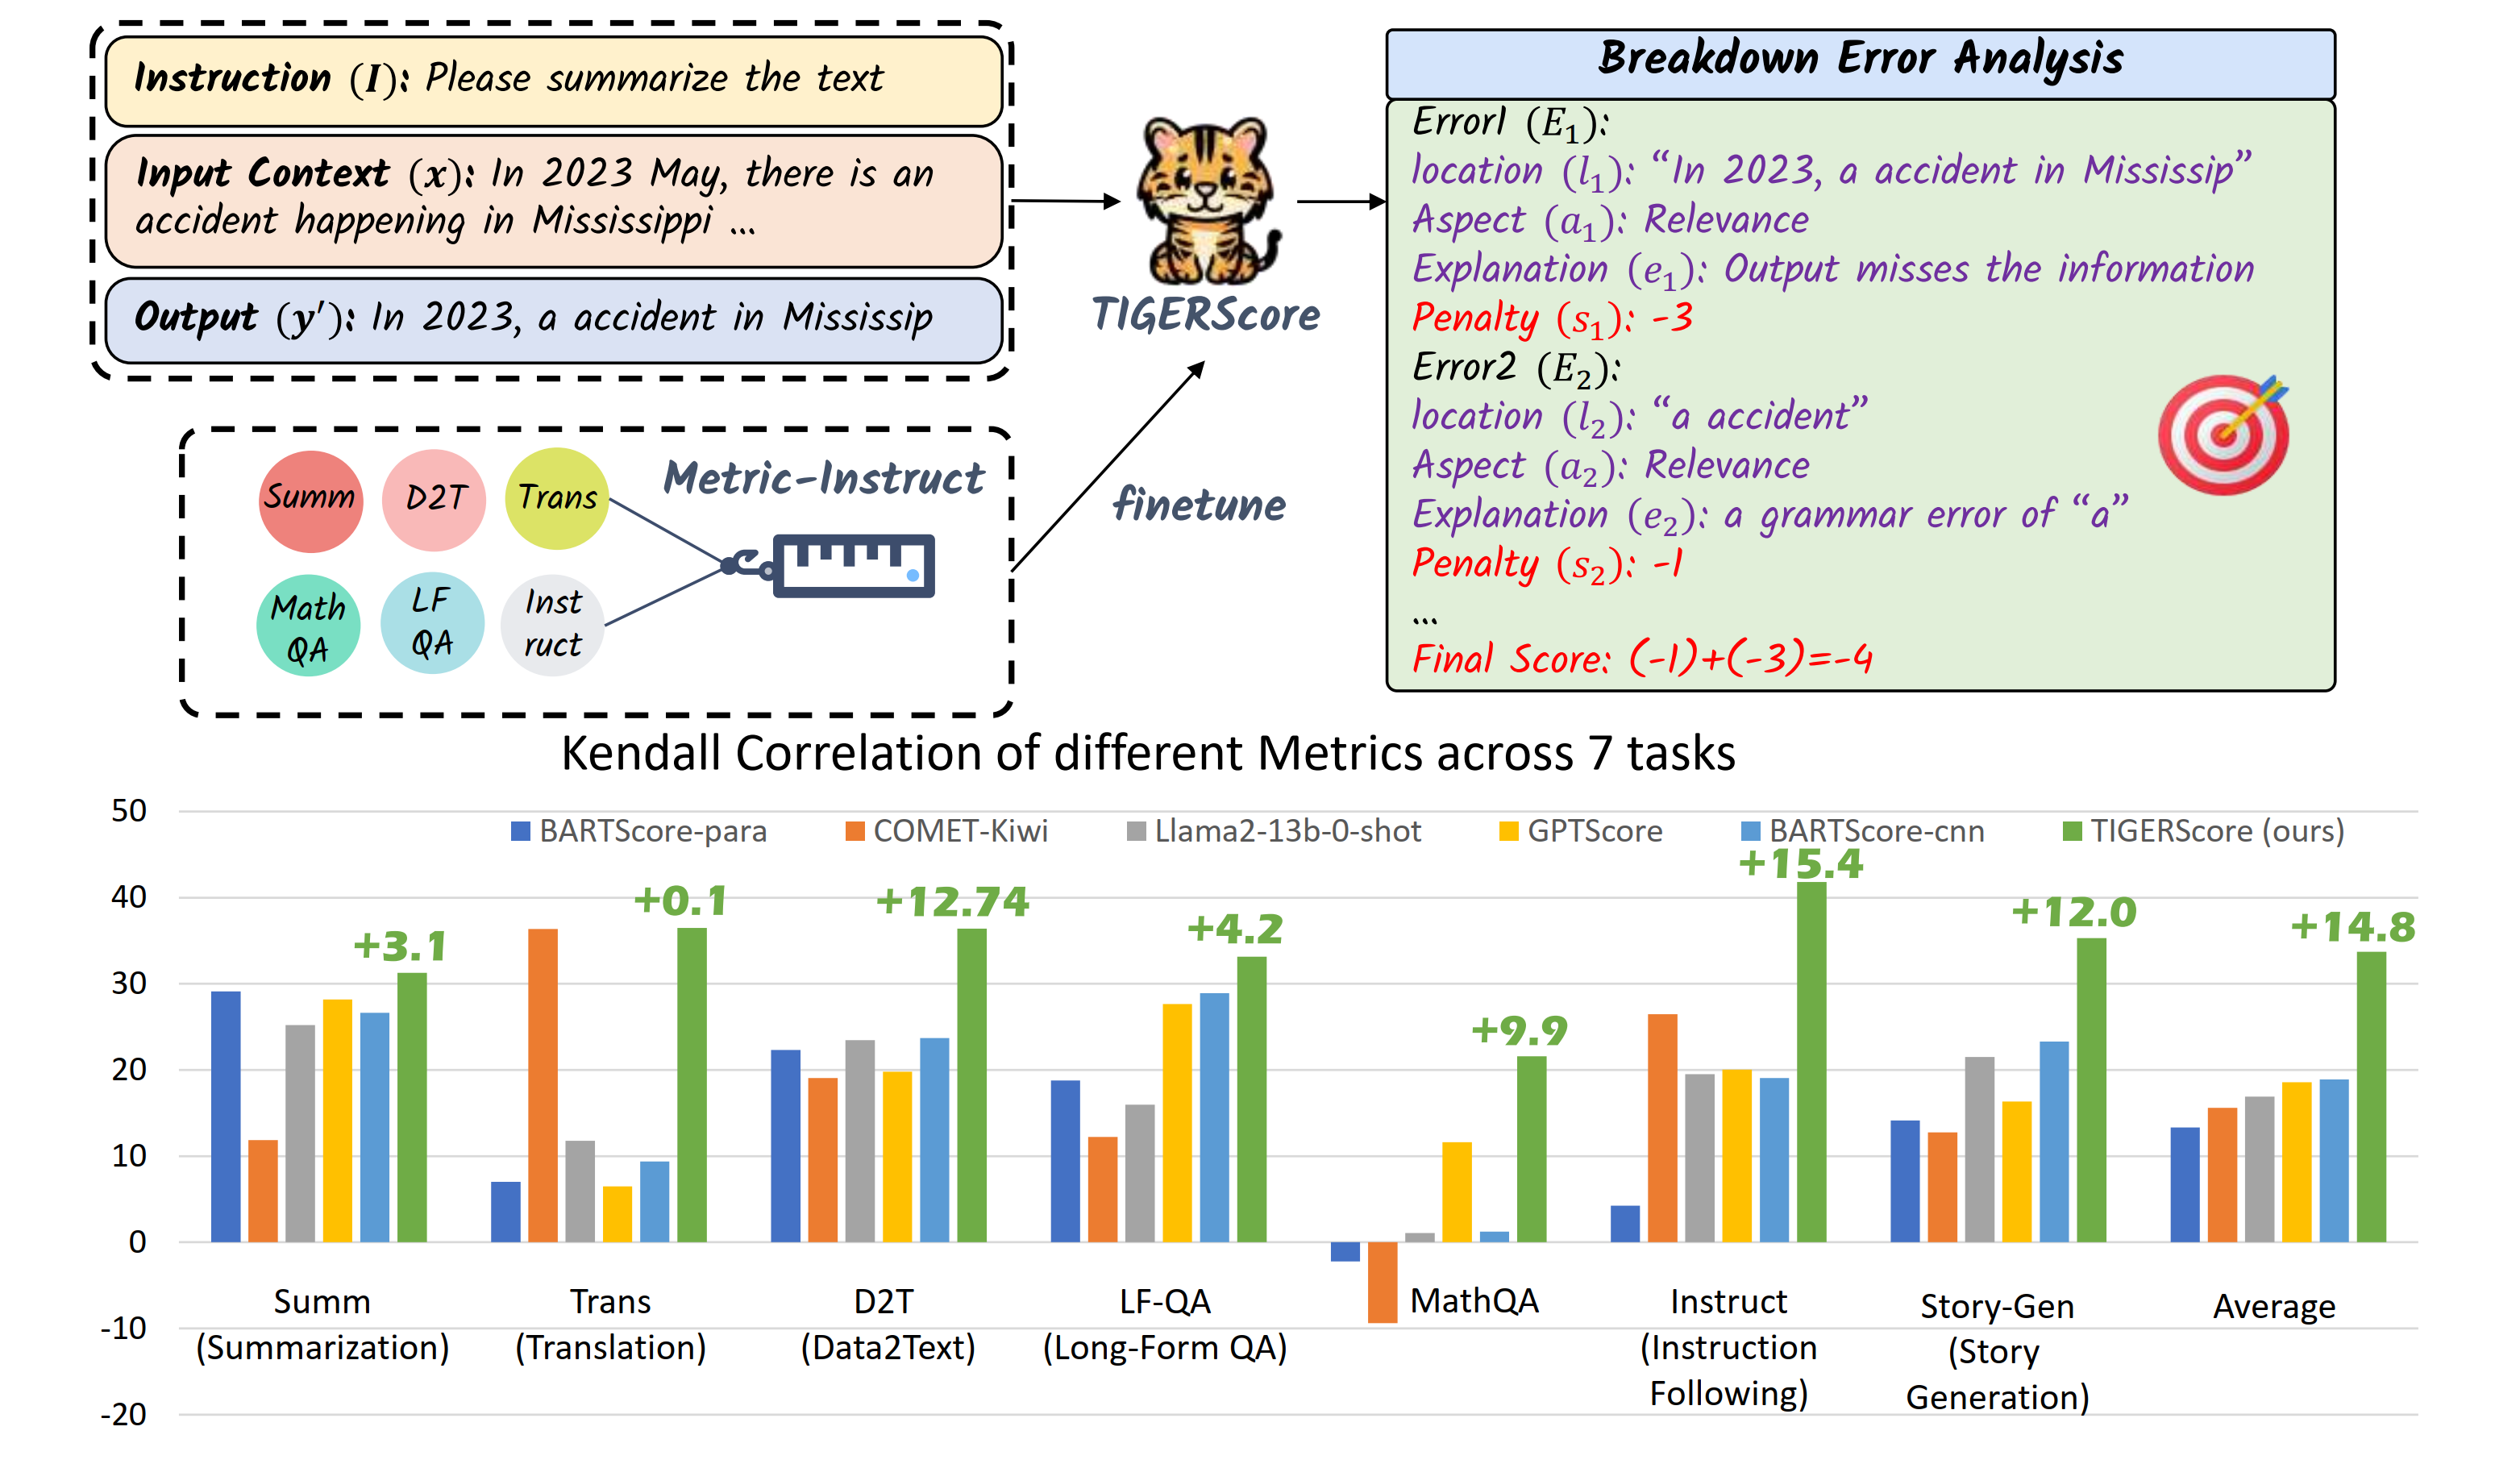
We present 🐯TIGERScore, a Trained metric that follows Instruction Guidance to perform Explainable, and Reference-free evaluation over a wide spectrum of text generation tasks. Different from other automatic evaluation methods that only provide arcane scores, TIGERScore is guided by natural language instruction to provide error analysis to pinpoint the mistakes in the generated text. Our metric is based on LLaMA-2, trained on our meticulously curated instruction-tuning dataset 📏MetricInstruct which covers 6 text generation tasks and 23 text generation datasets. The dataset consists of 42K quadruple in the form of (instruction, input, system output → error analysis). We collected the `system outputs' through from a large variety of models to cover different types of errors. To quantitatively assess our metric, we evaluate its correlation with human ratings on 5 held-in datasets, 2 held-out datasets and show that TIGERScore can achieve the open-source SoTA correlation with human ratings across these datasets and almost approaches GPT-4 evaluator. As a reference-free metric, its correlation can even surpass the best existing reference-based metrics. To further qualitatively assess the rationale generated by our metric, we conduct human evaluation on the generated explanations and found that the explanations are 70.8% accurate. Through these experimental results, we believe TIGERScore demonstrates the possibility of building universal explainable metrics to evaluate any text generation task.
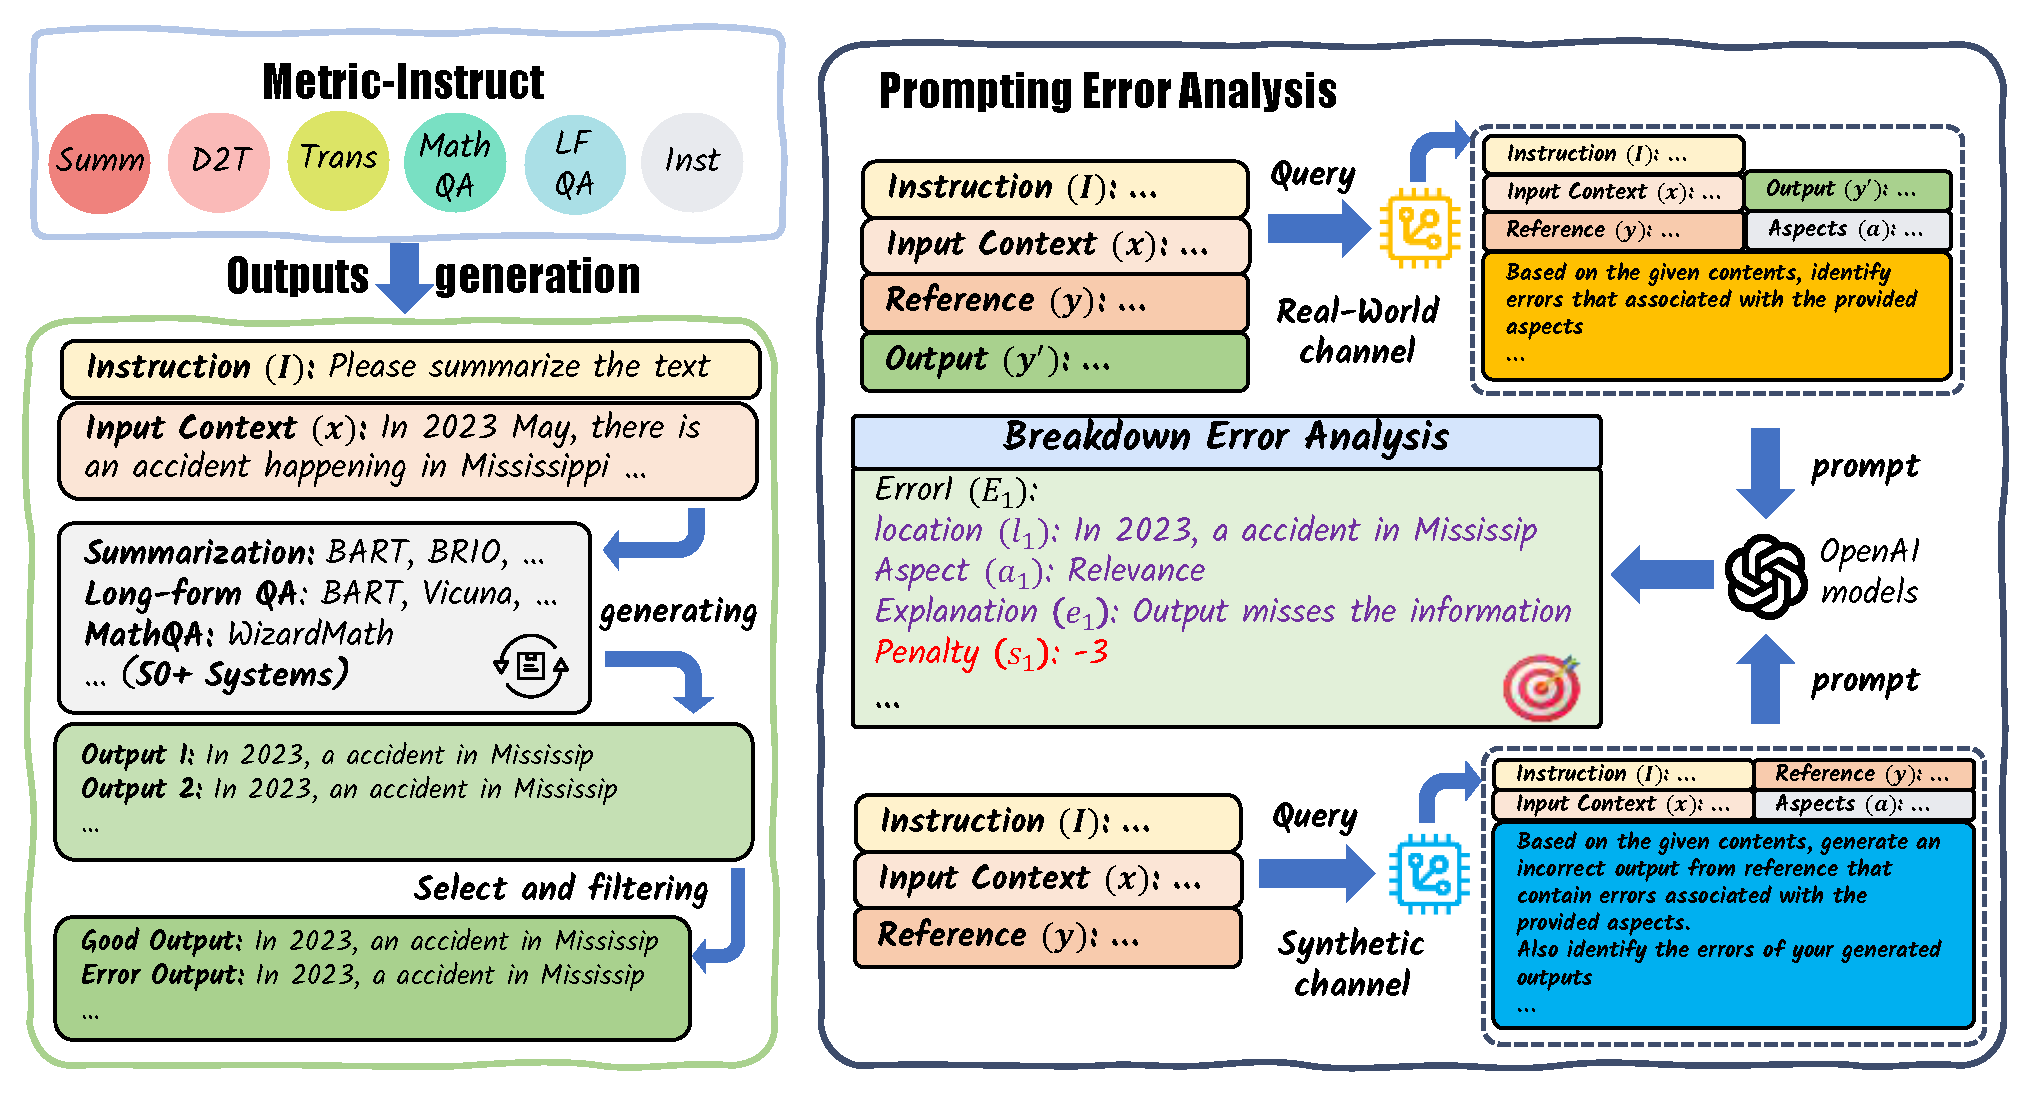
We present the MetricInstruct dataset, which is employed to fine-tune TIGERScore. The
three
underlying criteria for dataset construction are:
| Tasks→ | Summarization | Translation | Data2Text | Long-form QA | MathQA | Instruction-Following | Story-Gen | Average |
| GPT-3.5-turbo (few-shot) | 30.45 | 32.30 | 30.38 | 20.91 | 58.57 | 17.73 | 3.26 | 27.65 |
| GPT-4 (zero-shot) | 29.32 | 35.38 | 32.26 | 35.85 | 46.63 | 49.50 | 25.69 | 36.38 |
| BLEU | 8.71 | 14.50 | 23.13 | 7.73 | 17.25 | 35.92 | -0.89 | 15.19 |
| ROUGE-2f | 10.67 | 13.19 | 24.74 | 11.73 | 18.07 | 34.59 | 1.78 | 16.40 |
| InstructScore | 20.86 | 40.44 | 30.21 | 15.64 | -3.87 | 13.87 | 13.50 | 18.66 |
| GPTScore-ref | 10.80 | 18.74 | 27.47 | 22.13 | 14.86 | 25.40 | 12.78 | 18.88 |
| BARTScore-cnn(hypo-ref) | 10.00 | 21.06 | 27.04 | 20.67 | 19.07 | 24.70 | 18.58 | 20.16 |
| BARTScore-para (hypo-ref) | 10.41 | 24.90 | 28.42 | 20.24 | 14.10 | 26.13 | 12.11 | 19.47 |
| BERTScore | 17.39 | 31.57 | 30.74 | 17.70 | 9.41 | 35.61 | 2.00 | 20.63 |
| BLEURT | 12.69 | 36.12 | 34.48 | 21.11 | 2.88 | 27.94 | 19.18 | 22.34 |
| UniEval(summ) | 35.89 | 16.08 | 28.56 | 29.32 | 16.15 | 11.93 | 31.22 | 24.17 |
| COMET-22 | 25.01 | 42.79 | 23.43 | 24.66 | -4.52 | 36.17 | 27.52 | 25.01 |
| BARTScore-para (src-hypo) | 29.12 | 7.01 | 22.32 | 18.80 | -2.21 | 4.26 | 14.15 | 13.35 |
| BARTScore-cnn (src-hypo) | 26.63 | 9.40 | 23.69 | 28.93 | 1.23 | 19.09 | 23.29 | 18.89 |
| Llama-2-13b-chat-0-shot | 25.22 | 11.79 | 23.45 | 15.96 | 1.08 | 19.50 | 21.52 | 16.93 |
| COMETKiwi | 11.87 | 36.37 | 19.08 | 12.23 | -9.38 | 26.46 | 12.78 | 15.63 |
| GPTScore-src | 28.20 | 6.50 | 19.81 | 27.64 | 11.64 | 20.04 | 16.36 | 18.60 |
| TIGERScore-7B (ours) | 28.79 | 33.65 | 32.44 | 33.93 | 19.98 | 38.13 | 29.72 | 30.95 |
| TIGERScore-13B (ours) | 31.29 | 36.50 | 36.43 | 33.17 | 21.58 | 41.84 | 35.33 | 33.73 |
| Δ (ours - best reference-free) | +2 | +0 | +13 | +4 | +10 | +15 | +14 | +15 |
| Δ (ours - best reference-based) | -4 | -6 | +2 | +4 | +2 | +5 | +4 | +8 |
The reasonableness of the error analysis provided by TIGERScore was assessed through
a
random selection of 50 error analyses from each evaluation dataset.
These error analyses are then evaluated by human experts who rated them from the
following perspectives:
| Aspects | Explaination Error? | Overlooked Errors | Helpful of Revision Suggestions | Overall Rating | ||||||||||||
| Task↓ Rate→ | Correct | Wrong | 1 | 2 | 3 | 4 | 1 | 2 | 3 | 4 | 5 | 1 | 2 | 3 | 4 | 5 |
| Summ | 70 | 35 | 2 | 17 | 15 | 16 | 6 | 4 | 19 | 7 | 14 | 3 | 10 | 17 | 7 | 13 |
| Trans | 54 | 25 | 3 | 8 | 17 | 22 | 2 | 7 | 17 | 6 | 18 | 3 | 6 | 15 | 9 | 17 |
| D2T | 19 | 21 | 1 | 8 | 10 | 31 | 11 | 8 | 9 | 3 | 19 | 11 | 10 | 4 | 7 | 18 |
| LF-QA | 42 | 19 | 4 | 10 | 11 | 25 | 5 | 8 | 14 | 7 | 16 | 6 | 8 | 10 | 6 | 20 |
| MathQA | 39 | 26 | 5 | 12 | 12 | 21 | 5 | 7 | 19 | 5 | 14 | 4 | 9 | 10 | 13 | 14 |
| Instruct | 5 | 9 | 5 | 5 | 8 | 32 | 21 | 3 | 5 | 2 | 19 | 9 | 4 | 3 | 7 | 27 |
| Story-Gen | 66 | 29 | 7 | 16 | 13 | 14 | 7 | 6 | 16 | 10 | 11 | 7 | 12 | 11 | 9 | 11 |
| Total | 295 | 164 | 27 | 76 | 86 | 161 | 57 | 43 | 99 | 40 | 111 | 43 | 59 | 70 | 58 | 120 |
Table 4:Human evaluation results, the first question is asked per error in error analyses, and the others are per sample. Superior performance is indicated by higher numerical values. The most-voted rate of each task for each human evaluation aspect is bolded.
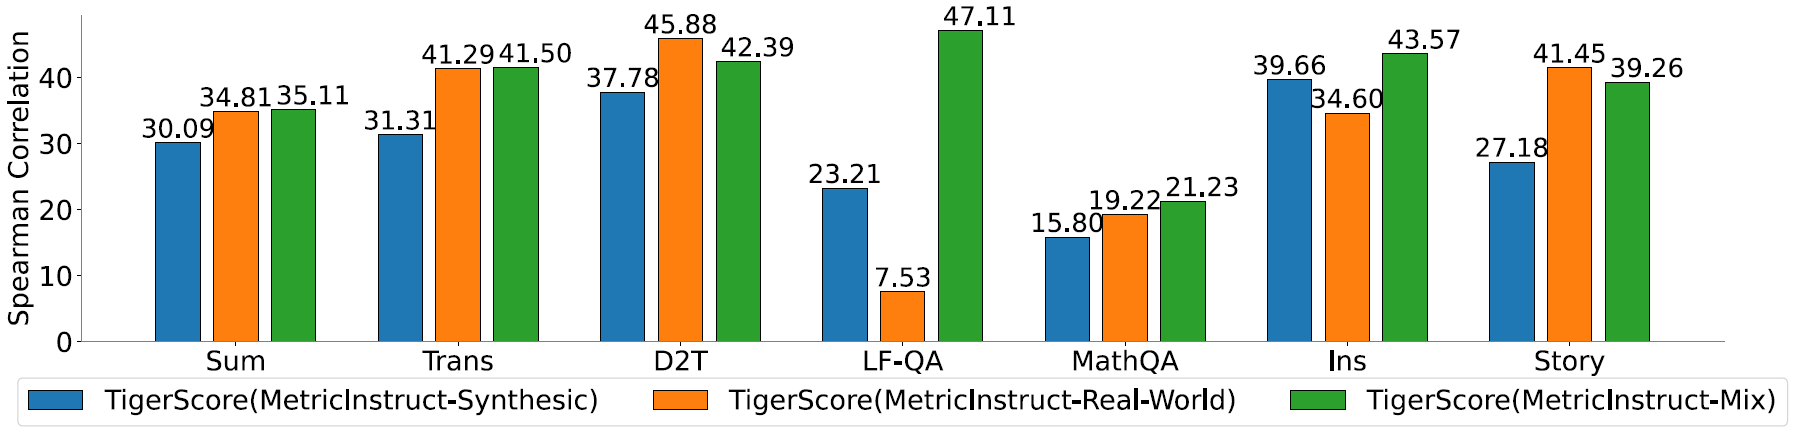
To investigate the significance of our two-channel data in contributing to the strong
performance of TIGERScore, we conducted a series of experiments with the following
setups:
Significantly, the Mix model outperformed both ReW and Syn in 5 of the 7 tasks. It also achieves an average correlation approximately 20% higher than ReW and 31% higher than Syn. Although there are slight decreases in correlation for the D2T and Story-Gen tasks when mixing data, the absolute correlation scores for them are around 40, which is considerably high. We think it's an acceptable compromise for the overall model performance. These findings demonstrate the successful complementary nature of our two-channel data, leading to enhanced performance when combined.
@article{Jiang2023TIGERScoreTB,
    title={TIGERScore: Towards Building Explainable Metric for All Text Generation Tasks},
    author={Dongfu Jiang and Yishan Li and Ge Zhang and Wenhao Huang and Bill Yuchen Lin and Wenhu Chen},
    journal={ArXiv},
    year={2023},
    volume={abs/2310.00752},
    url={https://api.semanticscholar.org/CorpusID:263334281}
}
}