VIEScore2: Unified Image Evaluation with Spatially Grounded Explanations

Xianda Du*♠, Max Ku*♠, Weiming Ren♠, Zhi Rui Tam♡, Chunlin Ren♢, Ping Nie♠, Min-Hung Chen♣, Wenhu Chen♠
♠University of Waterloo, ♣NVIDIA, ♡National Taiwan University, ♢Nanyang Technological University *Equal contribution
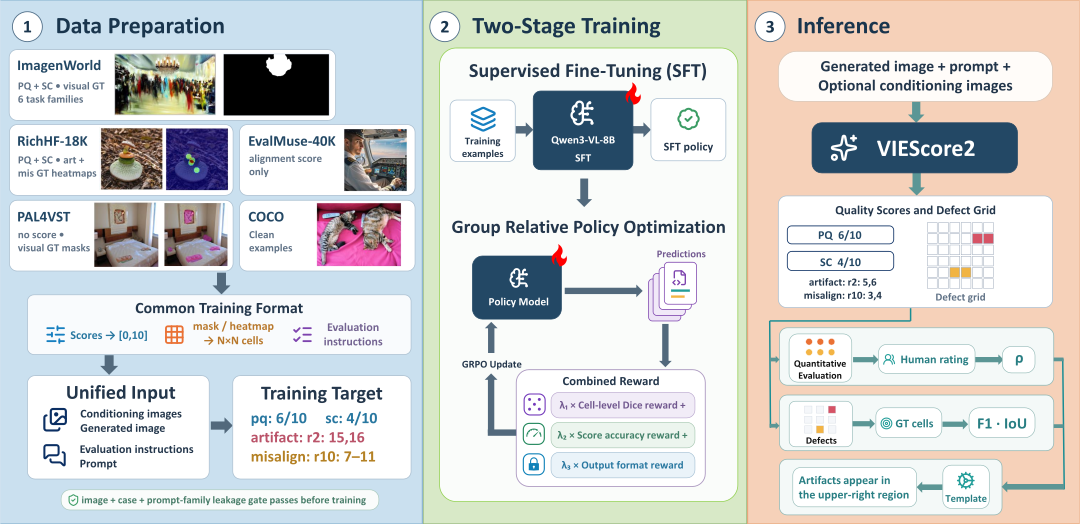
An evaluation example with VIEScore2

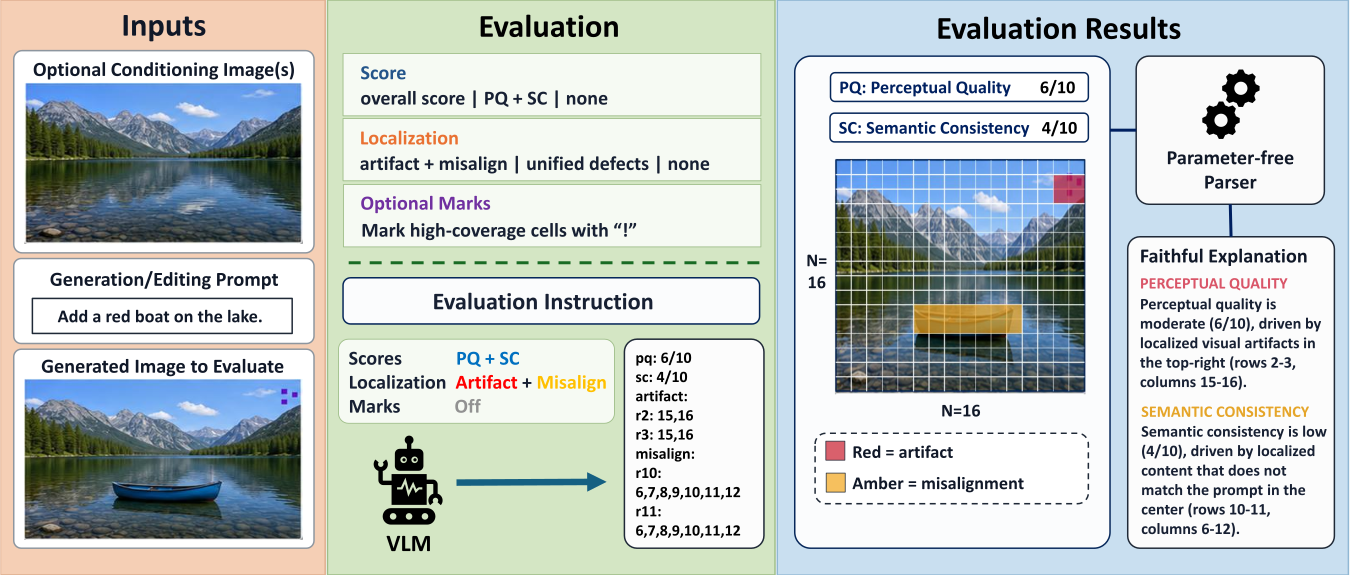
Figure 1: An evaluation example with VIEScore2. The model predicts perceptual quality (PQ), semantic consistency (SC), and a 16×16 defect grid, where red and amber denote visual artifacts and semantic misalignments. A parameter-free parser converts the predictions into natural language.

Abstract

Existing synthetic image evaluators typically provide only a scalar quality score and do not identify the image regions that support it. We introduce VIEScore2, a unified evaluator for image generation and editing tasks with optional conditioning images. VIEScore2 represents an image as an N×N grid and jointly predicts quality scores and defect locations in a single model pass. Its text-native grid representation provides a common interface for heterogeneous spatial supervision and enables directly verifiable post-training objectives. We train on 38K examples spanning score-only, localization-only, and joint supervision across generation and editing tasks. Starting from supervised fine-tuning, we further apply GRPO to improve defect localization using rewards that combine cell-level Dice overlap, score accuracy, and output-format validity. A parameter-free parser converts the structured predictions into readable explanations. On the primary suite, VIEScore2 achieves an overall-score SRCC of 0.601, compared with 0.491 for Gemini-3-Flash, the strongest zero-shot general-purpose VLM baseline under matched inputs. For defect localization, VIEScore2 outperforms both general-purpose VLMs and specialized spatial evaluators on three of six benchmarks in per-image grid IoU and ranks among the top three on five, including datasets beyond its training sources.

How VIEScore2 works

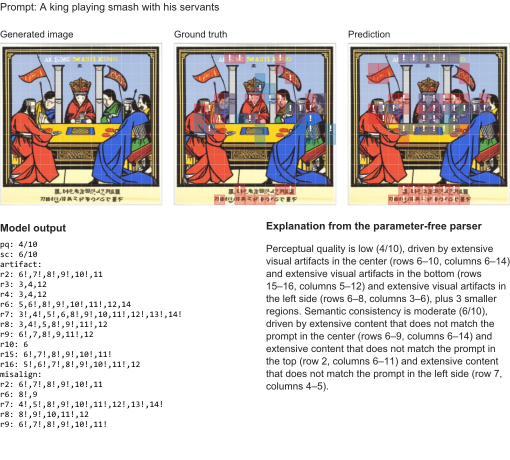
Heterogeneous spatial supervision (masks, heatmaps) from ImagenWorld, RichHF-18K, PAL4VST and COCO, together with score-only data from EvalMuse-40K, is converted into one common training format: scores on a [0,10] scale and defect cells on an N×N grid. Qwen3-VL-8B is first trained with supervised fine-tuning, then with GRPO using a combined verifiable reward: a cell-level Dice reward, a score accuracy reward, and an output format reward. All rewards are computed from the parsed outputs without a learned reward model. At inference, a parameter-free parser turns the predicted scores and defect grid into a faithful explanation.

Overview of VIEScore2

Figure 2: Overview of VIEScore2: data preparation, SFT and GRPO training, and inference. GRPO combines Dice, score, and format rewards. The parameter-free parser converts predicted scores and defect grids into explanations. GT denotes ground truth.

Strong localization across benchmarks

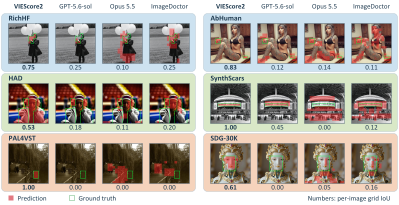
VIEScore2 ranks first in per-image grid IoU on RichHF (0.299), PAL4VST (0.335), and SynthScars (0.234), second on HAD, and third on AbHuman. It also leads in SynthScars F1 (0.368). The top-three IoU rankings on five benchmarks show competitive localization across training sources and additional datasets.

Training sources Additional datasets
RichHF PAL4VST AbHuman HAD SynthScars SDG-30K
Method IoUF1 IoUF1 IoUF1 IoUF1 IoUF1 IoUF1
Qwen3-VL-8B0.0220.1370.0260.1240.0240.1080.0440.1110.0260.1170.1140.269
GPT-5.6-terra†0.0960.2180.1180.2390.1710.2170.1480.2510.1620.2810.0580.217
GPT-5.6-sol†0.1560.2740.1410.2480.2170.2820.2110.2980.1860.2900.0780.258
Gemini-3-Flash†0.0470.0820.0480.0680.0570.0790.0750.1190.0620.1010.0310.068
Claude Opus 5.5†0.1670.2850.1400.2250.1460.3080.1420.2350.1960.3580.0840.216
PAL0.0140.0350.3060.5350.0090.0160.0090.0380.0270.0460.0070.014
SegFormer-b00.2740.4500.1460.2370.1300.2460.1560.2860.1700.2830.1030.260
RAHF0.2850.4740.1050.1690.1410.2600.1640.2810.1720.2940.0680.164
ImageDoctor0.2840.4710.1000.1670.1440.2930.1580.2750.1690.3050.0860.207
LEGION§0.0860.1760.0740.1300.1740.1520.1910.3240.2180.3630.0380.120
SDG0.1400.2430.1150.1960.2530.2920.1540.2280.2220.3300.1370.353
VIEScore20.2990.4660.3350.4390.2150.1940.1970.3140.2340.3680.1020.272

Table 1: Defect localization on six test sets using a shared 16×16 grid. Methods use their supported inputs. IoU averages per-image overlap; F1 pools cell counts. †API models use fixed prompts and temperature 0; §LEGION uses its released intermediate checkpoint. Bold: best; underline: second best.

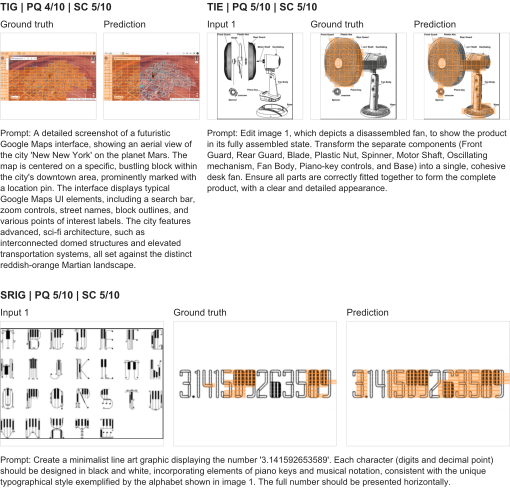
Qualitative defect-localization examples

Figure 3: Selected defect-localization examples across six benchmarks. Red cells denote predictions and green outlines denote ground-truth defect regions. Numbers report per-image grid IoU.

Joint scoring and localization across tasks

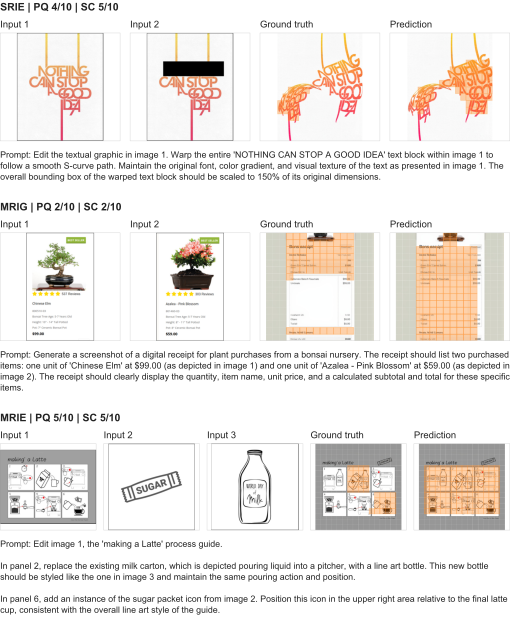
On the primary suite, VIEScore2 achieves the highest aggregate overall-score SRCC (0.601), followed by Gemini-3-Flash (0.491) and GPT-5.6-sol (0.437). All models receive the generated image, prompt, and available conditioning images. ImagenWorld covers text-to-image generation (TIG), text-guided editing (TIE), and generation/editing with one (SRIG/SRIE) or multiple conditioning images (MRIG/MRIE).

MethodAllRichHFEvalMuseTIGTIESRIGSRIEMRIGMRIE
Qwen3-VL-8B judge‡0.3730.4560.4730.5700.0660.1280.3930.537−0.290
GPT-5.6-terra†0.4020.4400.5670.6400.4930.2580.1100.5230.539
GPT-5.6-sol†0.4370.4700.6550.6230.5900.2750.2530.5390.684
Gemini-3-Flash†0.4910.5150.5350.5310.6860.3560.4040.4180.677
VIEScore20.6010.6920.8030.5890.4290.3750.4030.5090.417

Table 2: Overall-score SRCC on the primary suite (900 examples) with matched χK inputs. †API correlations use successfully parsed scores. ‡Qwen3-VL-8B uses our evaluation instructions without fine-tuning.

In the joint setting, VIEScore2 achieves higher localization F1, grid IoU, and PQ and SC correlations than the two baselines evaluated with the same inputs.

ModelGrid IoUF1PQ SRCCSC SRCC
Qwen3-VL-8B0.0700.2730.1810.352
GPT-5.6-terra†0.1120.2470.3570.508
VIEScore20.3240.5060.5580.564

Table 3: Joint evaluation with matched χK inputs. Localization uses 1,100 examples; PQ/SC SRCC uses 700. Grid IoU excludes empty ground-truth grids. †GPT-5.6-terra returns valid scores for 554/700 examples.

GRPO and grid resolution

Across three independent runs, GRPO improves grid IoU by 0.024–0.029 over the shared SFT checkpoint, whereas an additional SFT epoch gives 0.001. Training with the cell-level Dice reward alone raises grid IoU from 0.296 to 0.320, accounting for most of the gain; the full reward reaches 0.324 IoU and 0.506 F1 at an overall-score SRCC of 0.601.

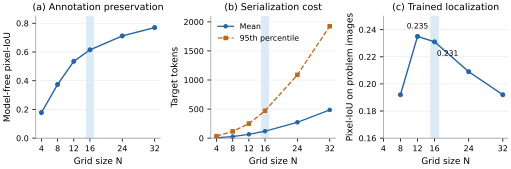
We choose N=16: trained pixel-IoU is similar at N=12 and N=16 (0.235/0.231) and falls to 0.192 at N=32, while N=16 preserves annotations better than N=12 (model-free pixel-IoU 0.615/0.535) and its 95th-percentile target is far shorter than at N=32 (471/1,926 tokens).

Grid resolution trade-off

Figure 4: Grid resolution versus annotation fidelity, output length, and trained localization. Annotation fidelity compares grids with native masks. Shading marks N=16.

Citation

Citation will be available soon.